
Managing customer communications across various channels, including telephone, email, chat, or social media, is a pivotal aspect of call center operations. The average time a caller spends in a queue has risen to approximately 69.4 seconds, reflecting increasing call volumes and the challenges of maintaining quick response times. Call center software is specifically engineered to aid sales agents and their supervising teams in managing these communications while also tracking essential performance metrics. This ultimately aids in the improvement of workforce management and customer outcomes.
Salesforce performance is fundamental in assessing both the team and individual agent performances. Hence, the selection of meaningful metrics is crucial. The objective here is to highlight crucial call center KPIs and clarify the steps involved in setting up a call center KPI dashboard in Salesforce.
Essential Call Center KPIs
- First Call Resolution (FCR): A vital KPI that signifies resolving a customer’s concern during the initial call. Attaining a high FCR not only conserves time but also establishes a positive and enduring impression on the customer. This KPI can be determined by using the total count of received calls and the count of queries resolved on the initial call.
- Wait Time: This relates to the length of time a customer has to wait before an agent answers their call. It is imperative to minimize this KPI to guarantee customer contentment.
- Time Spent on a Call: This KPI identifies the average duration an agent spends on a call. A reduced average time indicates that more customer queries can be addressed, whereas a higher average implies the agent requires additional coaching to resolve issues effectively.
- Top-Performing Agents: Acknowledging and appreciating top-performing agents is crucial for sustaining high morale and motivating employees. KPIs like average daily calls and the percentage of solutions delivered on the initial call can assist in identifying these high performers.
- Number of Calls vs. Calls Answered vs. Calls Missed: This comparison is critical for evaluating agent utilization. A high count of missed calls necessitates investigation and correction as it may cause customers to switch to a rival.
- Occupancy Rate: This refers to the total duration an agent is engaged on a call compared to the total time they are logged in. It is crucial for assessing the work rate of the agents and is essential for delivering optimal service to customers.
- Customer Satisfaction: Assessing customer satisfaction post-calls using a customer satisfaction feedback on Salesforce cases can offer valuable insights into an agent’s performance and the probability of retaining customers.
- Peak Time: Supervising incoming traffic is essential for planning staffing requirements and managing peak times efficiently.
Call Center Dashboard Metrics
Call center dashboards generally track two broad categories: agent performance and call center performance. These dashboards allow executives and managers to assess relevant performance at a glance and commonly track the following metrics:
- Call Center Statistics
- Call Center Performance
- Agent Performance Indicators
- Average Wait Time Trends
- Average Talk Time Trends
Configuring a Salesforce Call Center KPI Dashboard
- Comprehending KPIs: The initial step in setting up a call center KPI dashboard involves a comprehensive understanding of the KPIs that are most pertinent to your business. Common live agent KPI reports in Salesforce comprise Average Handling Time, First Call Resolution, Customer Satisfaction, and Call Abandonment Rate.
- Accessing Salesforce Reports: Salesforce incorporates a feature that enables users to generate reports. To utilize this, navigate to the ‘Reports’ tab in Salesforce and click ‘New Report’. Choose ‘Call Center’ as the report category.
- Crafting a Dashboard: Post the report creation, the subsequent step is to formulate a dashboard to visualize the data. Navigate to the ‘Dashboards’ tab and click ‘New Dashboard’. Incorporate the required components into your dashboard and select the previously created report as the data source.
- Tailoring the Dashboard: Modify the dashboard by incorporating charts, tables, and metrics that correlate to your KPIs. For instance, you can include a gauge chart for Average Handling Time and a pie chart for Call Distribution by Agent.
Apps From AppExchange
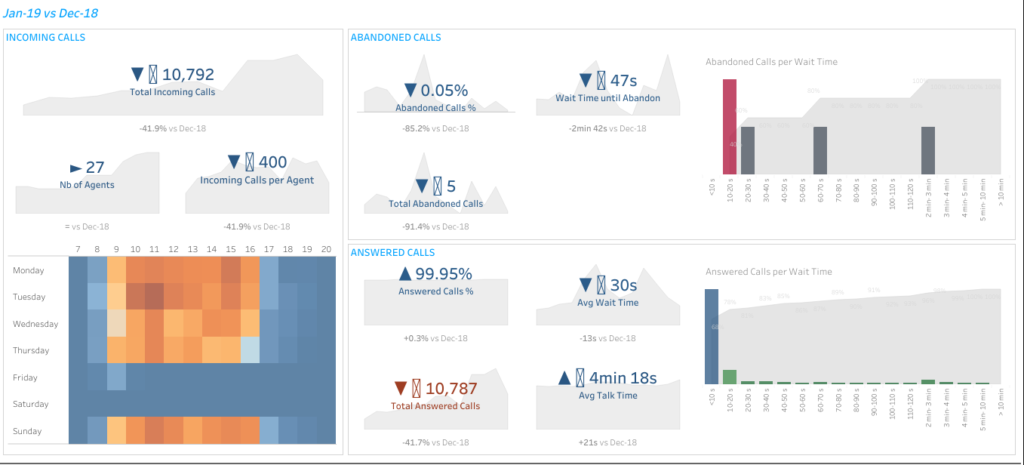
Tableau

Salesforce Tableau provides a simple, intuitive interface that allows users to effortlessly extract valuable insights from their data. Its minimalist design and smooth navigation make it accessible to users of all skill levels. With a variety of visualization options, including charts, diagrams, maps, scatter plots, and treemaps, Tableau caters to various needs, from presenting statistics to stakeholders to developing engaging infographics.
Additionally, Tableau’s dynamic features facilitate real-time exploration of data, enabling users to interact with specific figures, eliminate superfluous information, and modify visualizations as needed. This encourages a collaborative and investigative approach to data analysis. Moreover, Tableau’s ability to integrate with real-time data sources ensures that visualizations stay current, providing access to the most up-to-date insights at all times.
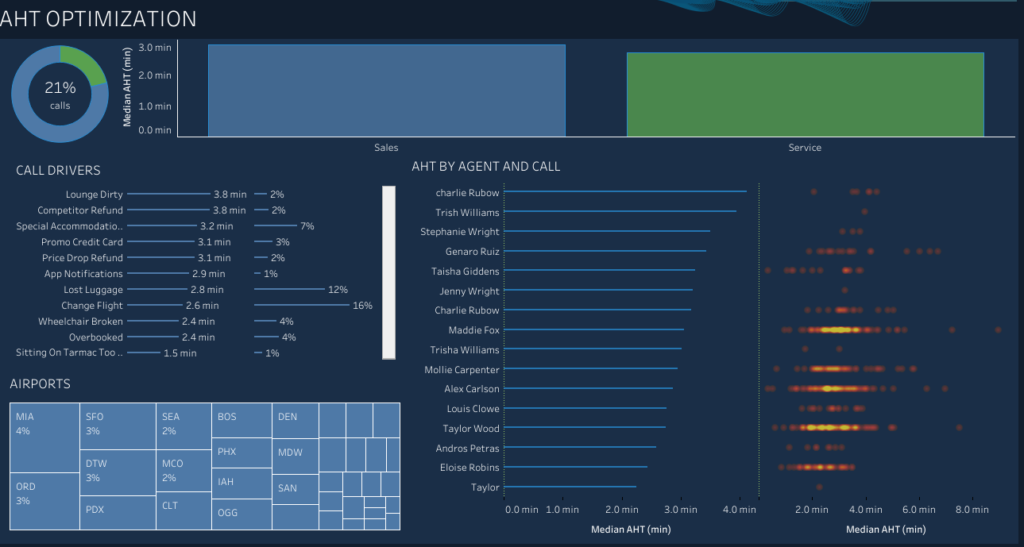
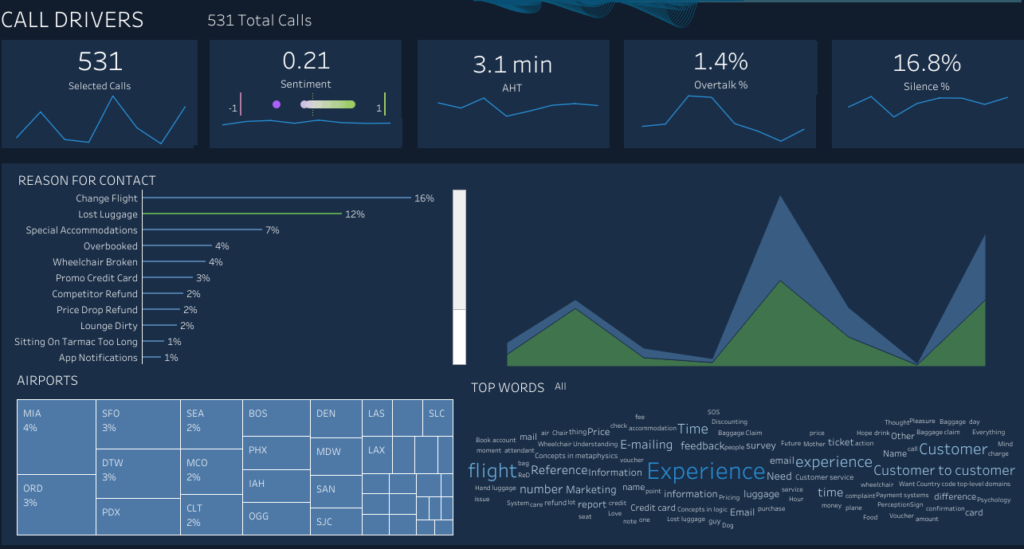
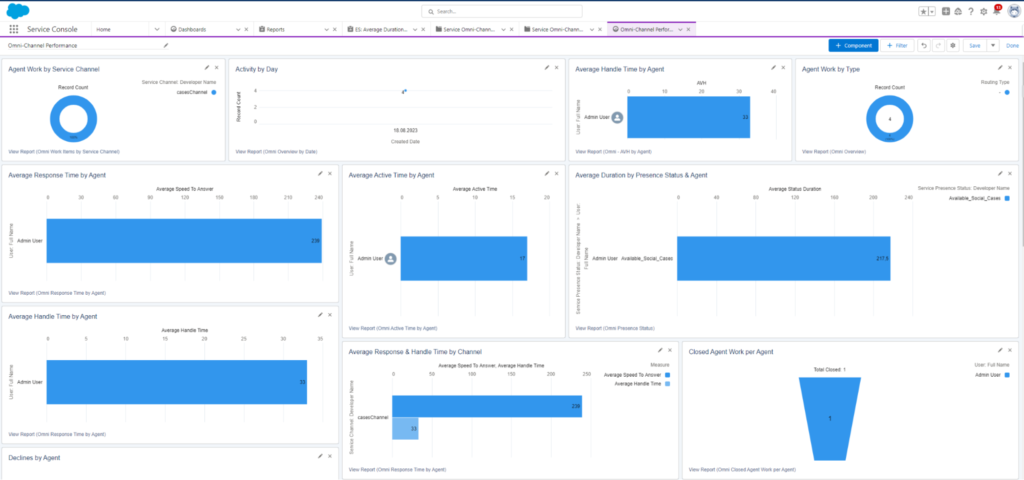
Omni-Channel Performance Dashboard
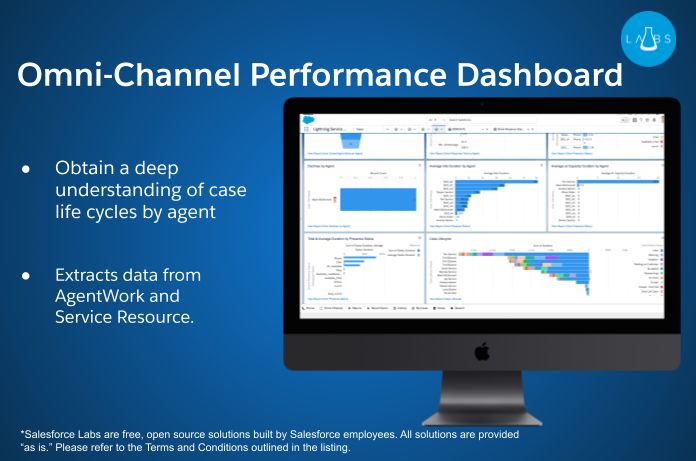
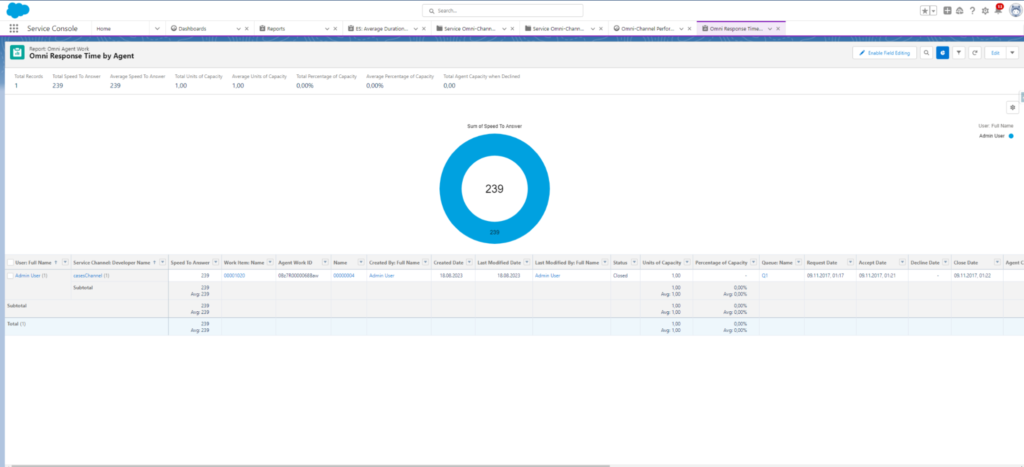
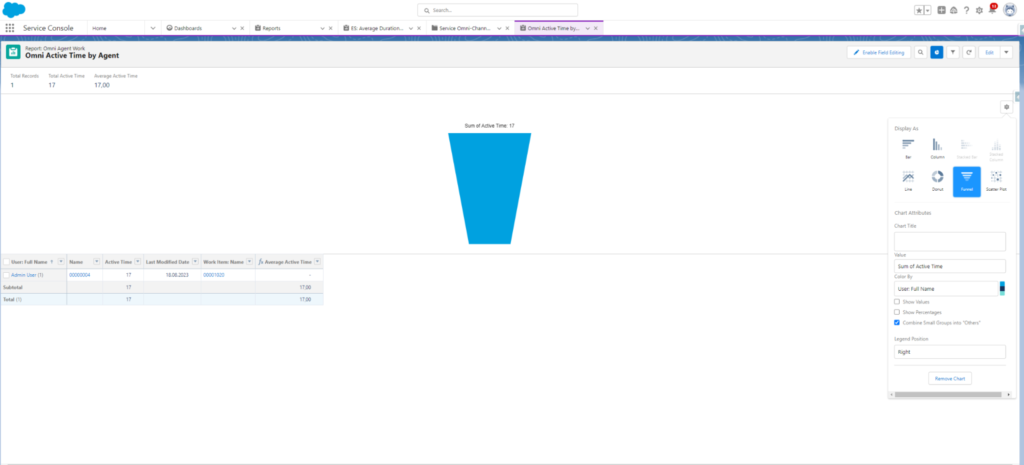
Omni-Channel Performance Dashboard is an invaluable tool for call center managers looking to optimize agent performance and provide targeted coaching. By accessing data from various sources and providing a comprehensive set of pre-built reports, the dashboard saves time and effort while delivering actionable insights to improve call center operations.
Insight:
Requires Service Cloud
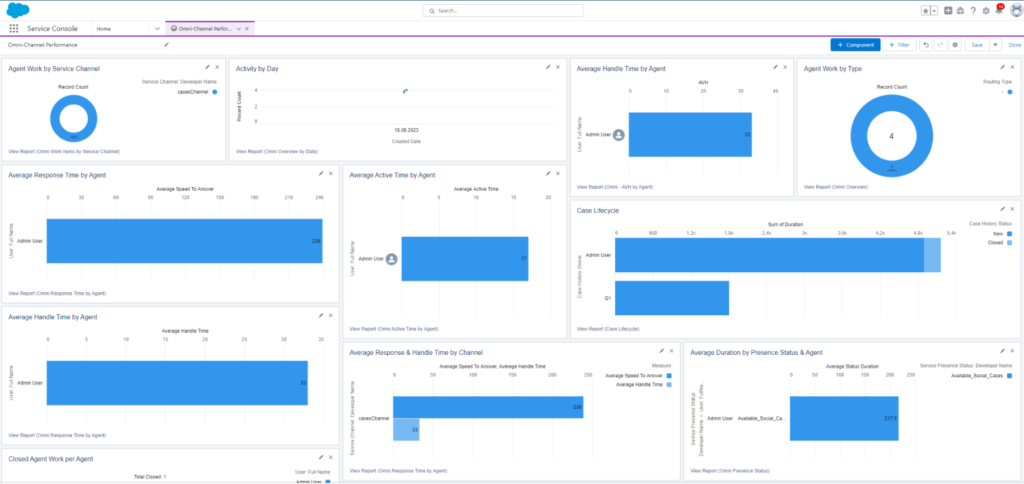
Insight:
- Significance of Real-time Data: Possessing real-time data is vital for making knowledgeable decisions swiftly. With real-time data, issues can be tackled as they emerge, rather than after they have intensified.
- Personalization is Essential: Tailor your dashboard to mirror the KPIs most pertinent to your business. Each call center may possess distinct operational necessities, hence it is crucial to select the KPIs most relevant to your operations.
- Leverage Plugins: Apps can augment your dashboard with extra features. Add these applications to optimize your dashboard’s potential.
FAQs on Optimizing Call Center Performance With Salesforce
How can I track individual performance Call Center Agent Performance Dashboard?
To effectively track individual call center agent performance using a dashboard, set up a Salesforce dashboard dedicated to showcasing metrics relevant to each agent’s daily tasks and overall efficiency. Key metrics to include are number of calls handled, call duration, resolution rate, customer satisfaction scores, and adherence to schedule. Customize the dashboard to display data in real-time and enable drill-down capabilities so managers can view more detailed information about each agent’s interactions. This allows for immediate feedback and targeted coaching, enhancing individual performance.
What are the benefits of using Tableau call center dashboard?
Using a Tableau dashboard for call center operations provides several benefits:
- Enhanced Visualization: Tableau’s strong visualization capabilities allow for complex data to be displayed in an easily digestible format, helping managers and agents quickly understand performance trends and areas of concern.
- Real-Time Data Access: Tableau can integrate with live data sources, providing up-to-date information that is essential for managing day-to-day operations efficiently.
- Customizable Interfaces: Users can customize dashboards to focus on specific metrics that matter most to their roles and responsibilities, enhancing productivity and focus.
- Scalability: Tableau dashboards can scale with the business, accommodating increasing amounts of data and more complex analytical needs without sacrificing performance.
- Interactivity: Interactive features allow users to explore data at a granular level, enabling detailed analysis of call center metrics to identify root causes of issues and potential improvements.
How do I create an effective contact center agent dashboard in Salesforce?
To create an effective contact center agent dashboard in Salesforce, begin by identifying the key metrics that reflect agent performance and customer service quality, such as average handle time, first call resolution, service level, and customer feedback scores. Use Salesforce’s dashboard tools to create visual components like charts, gauges, and leaderboards to represent these metrics. Make sure to set up the dashboard so that it updates in real-time or near real-time to provide the most current data. Customize views for different users, ensuring that agents, supervisors, and managers all have access to relevant information tailored to their needs. This targeted approach not only boosts individual agent performance but also helps in managing the overall efficiency of the contact center.
How can I build a comprehensive call center Tableau dashboard?
Building a comprehensive call center Tableau dashboard involves several steps:
- Data Integration: Start by ensuring that all relevant data sources, such as call handling software, customer feedback tools, and CRM systems, are integrated into Tableau.
- Define Key Metrics: Identify the key performance indicators that you want to track, such as call volume, call resolution time, customer satisfaction, and agent idle time.
- Dashboard Design: Design the dashboard layout by placing the most critical metrics in prominent views and using appropriate visualization types (e.g., bar charts for volume, line charts for trends).
- Add Interactivity: Incorporate filters, such as date ranges, agent names, or call types, to allow managers and agents to drill down into specific data segments.
- Test and Iterate: Before rolling out the dashboard, test it with end-users to gather feedback and make necessary adjustments. Iterative testing helps in refining the dashboard to better meet the needs of the call center.
- Training and Deployment: Provide training for all users on how to effectively utilize the dashboard, and deploy it across the call center for daily operations.
What is a KPI in a call center dashboard?
A Key Performance Indicator (KPI) in a call center dashboard is a measurable value used to evaluate the effectiveness of various aspects of call center operations. These KPIs help managers monitor and optimize performance by providing insights into how well the call center meets its objectives. Common KPIs include metrics like Average Handle Time (AHT), First Call Resolution (FCR), Customer Satisfaction (CSAT), and Call Abandonment Rate. These indicators are visualized on dashboards within call center software, like Salesforce, allowing real-time monitoring and strategic decision-making to improve both agent performance and customer satisfaction.
Conclusion
Configuring a call center KPI dashboard in Salesforce involves understanding relevant KPIs, creating reports, and customizing the dashboard. Utilizing plugins like Tableau and Omni-channel Performance Dashboard can enhance your dashboard with real-time updates and advanced visualization options. Ultimately, a well-configured KPI dashboard is essential for monitoring and optimizing call center performance.

Dorian is a 6X Certified Salesforce Developer and Administrator with a start in the IT world as a CRM Admin in 2020. Since diving into Salesforce in 2021 via Trailhead and Focus on Force, he has achieved a Ranger Rank, earned several Superbadges, and bagged certifications including the Salesforce Certified Administrator, Platform App Builder, Associate and Platform Developer I by 2023. In 2024 he also became Salesforce Certified AI Associate and earned Certified AI Specialist Certification in 2025. Dorian is very keen on continuous learning, always looks for fresh ways to improve his knowledge. He enjoys running, boxing, kickboxing and reading diverse kinds of books in his free time.


 Next Post
2 Responses to “Optimizing Call Center Performance With Salesforce”